

Is The SP500 About to Crash?
-

Updated:
US equities fell sharply over the previous days, ending their immediate uptrend momentum. Is a more extensive correction is ahead of us, or will the dip be quickly bought? We shall see.
During last week’s Powell presser, he said that the risk of persistingly higher inflation has clearly risen, and he thinks the (monetary) policy has adapted. Additionally, he announced that inflation doesn’t look transitory now (how shocking) and looks more structural.
As a result, it appears the Federal Reserve (Fed) has turned more hawkish, and it might quicken the pace of the tapering process, whihch is currently scheduled to end by July.
The Fed is Hawkish Amid Rising Inflation
This week’s US inflation data could confirm that view as CPI inflation is expected to rise further toward 7%, while the core inflation is also seen jumping toward 5%. At the same time, the Fed continues with its Quantitative Eesing (QA) program, buying 100 billion USD of bonds each month, and rates are at zero. It’s a crazy world.
The market now expects the Fed to raise rates in June 2022, and two to three rate hikes are priced in for the following year. Will that be enough to tame inflation? Likely no.
Additionally, investors have learned that every time there is a drop in stocks, the Fed comes to the rescue. But this time, it might be different. The central bank has no options for supporting the markets in this stage of the cycle – it must tighten monetary policy or risk double-digit inflation, destroying the middle class and leading to inflation spiraling out of control.
Therefore, the actual correction in equity indices might be the start of something more significant. We don’t want to sound any alarms, but equities are overbought, indices are driven higher by several large-cap stocks, and smaller companies are already in a downtrend.
The Daily Chart Still Seems Bullish
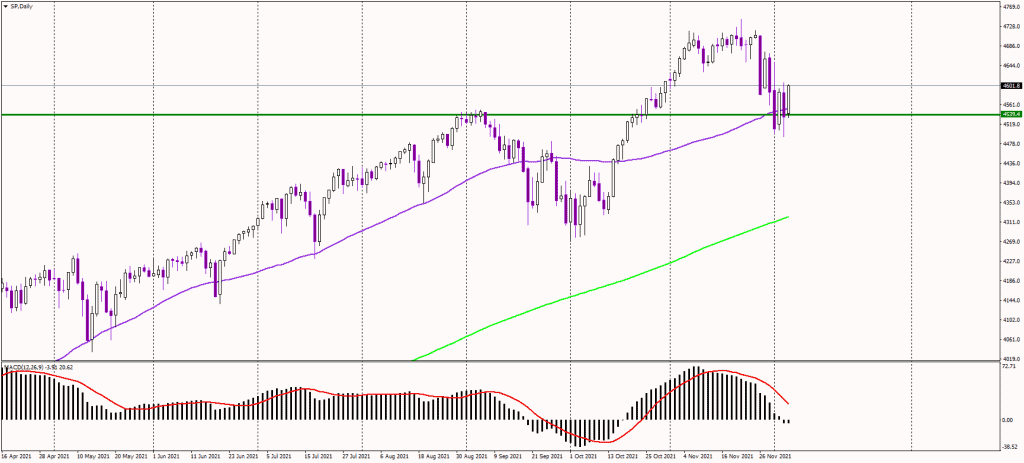
On the other hand, the technical situation for the SP500 index remains bullish. The latest correction brought the index to its 50-day moving average (purple line) and previous highs in the 4.550 USD area. Bulls immediately bought the dip, and it looks like the worst is over. However, the index must post new highs to confirm the bullish bias.
Alternatively, if the current bounce fails (amid the mentioned factors above), bears could push the index below 4,550 USD, targeting the 200-day average at around 4,350 USD. That would be a healthy correction in the current overbought environment.

