The Top 3 Reasons Traders Start Copy trading

Copy trading enables new traders to follow and automatically copy the trades of more experienced traders. It is often referred to as “master traders” or “top traders”.

These top traders have a proven track record of making money trading and they are eager to share their strategy with other traders. This way, they can copy the trades and benefit from the outcome. For this, you only need to open an account on a copy trading platform and select the trader you want to follow.

Below are the top three reasons why traders start to copy trade.

You Don’t Need Experience

Many people do not start trading just out of fear of messing up everything. They are afraid to make a bad decision and lose money. With copy trading, you do not have these worries, and you certainly do not need years of experience.

That’s a major plus because if you’re new to trading it can be hard to know where to invest your hard-earned money. The market can be quite misleading, as there are lots of markets and assets out there and it is often hard to know which investment will turn out to be profitable and which will fail. You might know about the best assets to buy, but you still need to know when it is more beneficial to buy them. The same is about selling. You can be worried that your assets can start dropping.

Copy trading is one of the easiest ways to use another trader's experience and expertise to your benefit. All you have to do is choose a trader who's getting good results, and who has proven to be able to make profitable trading decisions.

Saves Time On Research and Analysis

Many traders who get started don’t have the time or the skill to research the market properly. With copy trading, you don’t need to learn technical analysis or weigh up the pros and cons of different assets before you make a trade.

Top traders do their proper research, so you just need to follow the moves of a trader with experience and proof of success. This way, you will save a lot of time and nerves.

Builds Trader Confidence

Copy-trading helps beginner traders build confidence in their trading decisions. It is also a great way to learn more about the markets and learn to trade without undesirable risks. This way, you are more comfortable, and it is easier to build more confidence when you're trading.

On the contrary, it can be hard to have that confidence when you're a beginner trader. That’s natural because it’s easy to make mistakes, and panic-sell or optimistically make a wrong purchase. This is where copy trading can be of great benefit to you. Letting go of control and letting someone else make the decisions for you can really help you to stay calm and make good trading decisions.

Top traders have already done the hardest part and tested out a strategy. Now, all you have to do is put it into execution. Thus, you’re trading on a proven strategy. You don’t have to panic about whether the decision to buy or sell is good or not.

Conclusion

It is true that copy trading is a great way to get started trading without doing much research. However, it should be used as an opportunity to learn and grow as a trader. Trading volatile markets always hold risks, and there are no guarantees that you’ll make money. Copy trading is a shortcut that helps you make better decisions, learn meanwhile, and build much-needed trader confidence.

Oil Decline and Recession Fears

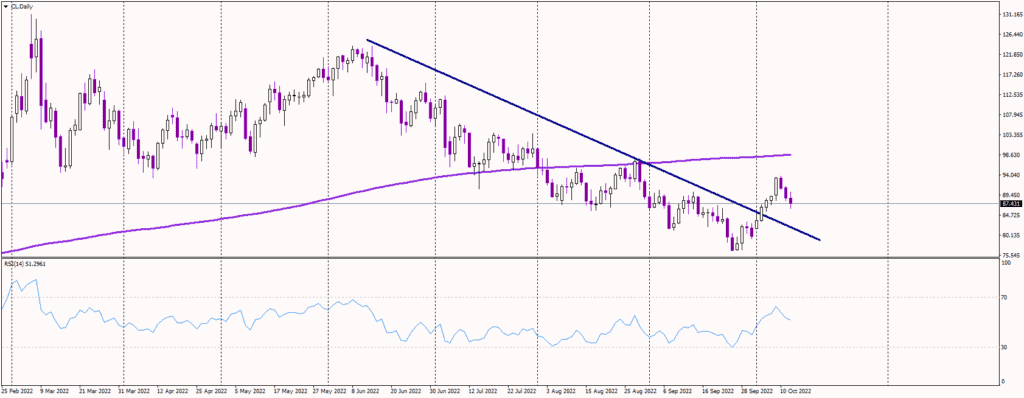
Only during the last few days, WTI oil plummeted below the critical 100 USD threshold, which can be described as a serious global economic depression. As Oil is considered one of the most sensitive assets investors chose to stay on the safe side and sell the cyclical commodity.

Russia Predicts an Inevitable Collapse

As oilprice.com mentions, Russian president Vladimir Putin states, that Europe will not be able to avoid catastrophic energy consequences, as long as the sanctions are in place.
"We know that the Europeans are trying to replace Russian energy resources. However, we expect the result of such actions to be an increase in gas prices on the spot market and an increase in the cost of energy resources for end consumers," these are Putin’s words from the meeting with senior officials.
Putin is sure, in time Europe will be the one to experience the impacts of the sanctions, even more than Russia itself (this is already partly true). Putin urges that the effects of the further use of sanctions will be catastrophic, and this is put mildly.

Recession Is Unavoidable

Based on numerous indicators, the US is already experiencing a recession. Moreover, energy and food prices show that many European countries will soon face the same fate. A recession usually results in a sharp decline in oil demand, which usually leads to lower prices.
"There's the technical part of the recession, but then there's the meaningful deterioration in consumption and employment," Sameer Samana, the Wells Fargo Investment Institute's senior global market strategist, expressed his concerns to Bloomberg. "The technical part is the first-half story, and the brunt of the unemployment and consumption is the second half," Samana explained.
Yet, in contrast to earlier anticipations, demand might not increase. Just like that, supply is not flourishing either. For instance, Saudi Arabia had to raise its prices for Asian consumers to record levels. When a fall in demand is anticipated for the products, sellers generally do not raise their prices.
Thus, Goldman Sachs’s assumption that oil might still reach 140 USD per barrel makes sense. Another anticipation from Damien Courvalin of Goldman is as follows, "140 USD is still the basic scenario because, unlike stocks, which are anticipatory assets, commodities need to answer for today's misaligned supply and demand."

Bearish Reversal?

For now, the price is below the uptrend line, which might be bearish. It is possible that oil will undergo a decline in the coming 200-day, at 94 USD.
However, if oil moves back above the uptrend line the price will possibly return to 120 USD.

3 Reasons Why Copy Trading Is So Popular

It was strictly against the rules in school. But copying from someone more knowledgeable than you when you’re trading online isn’t only allowed, it’s encouraged.

With a flurry of available copy trading apps, and more traders joining, it’s easy to see that copy trading has become more and more popular over the past few years.

But how? For those who are unfamiliar with copy trading, here are a few reasons why copy trading is catching on.

Practice Smarter, Not Harder

First-time skydivers connect to a more experienced pro when they jump out of an airplane for the first time. New traders choose to copy trade for a very similar reason. It takes a lot of the risk out of the experience. It’s also an easy way to learn the ropes. All you have to do is follow a more experienced trader and copy their moves. By doing that you can potentially profit from their strategies, while also avoiding costly amateur blunders.

Learn Quickly and More Easily

To become a profitable trader you need to understand the markets, and how they move. That can take time, and not every trader can devote several hours every day to learning. By copy trading, traders who have more experience make trading decisions for you, until you’re able to develop your own strategies. The technology is smart, slick, and user-friendly, making copy trading a practical way of quickly learning how to trade.

Diversify Your Portfolio and Grow Your Returns

Traders use copy trading to venture out into new markets by following and copying from traders with more experience in those markets. By broadening their trading horizons even more experienced traders can learn by copy trading. It’s a great way to diversify a trading portfolio without taking on a lot of risks. And as traders become more seasoned, they benefit through copy trading by sharing their trading successful strategies and growing their network.

How to Start Copy Trading

To start copy trading, you need to create an account with your chosen broker and download their copy trading app.
Once you’re logged in to the app, you can browse through the trader’s performance data and strategies, and choose one who has a good track record of consistent profits.
Once you’ve chosen your trader, you can set the amount you’re willing to invest. It's always a better idea to start with a small portion of your income and increase it as you become a more savvy trader.

Lastly, observe! Analyze what other traders are buying and selling. Both novice and seasoned traders can benefit by watching what other traders are doing.

May’s US Employment Situation Report in Focus

The non-farm payrolls report (taken from the establishment survey) attracts the majority of attention, often vibrating through financial markets. A favourable number (generally considered USD positive) reveals additional jobs were added to the economy, while a negative value (often viewed as USD negative), displayed as -100k or -90k, for example, means jobs were lost in non-farm business. 

April’s non-farm payroll’s release was a huge disappointment. Payrolls increased by a less-than-impressive 266,000, following March’s downwardly revised 770,000 reading. With this, May’s figure will be widely watched. Note the three-month rolling average stands at 524,000, and the six-month rolling average falls in around 294,000. 

According to the BLS, employment in leisure and hospitality increased more than 330,000 as a result of re-opening programmes across many parts of the country. 

April’s figure weighed on the US dollar—as measured by the US dollar index (ticker: DXY)—though only a mild reaction was observed in US equities, through the S&P 500. This was largely due to the expectation the United States Federal Reserve is likely to maintain near-zero interest rates.

The general consensus for May’s US non-farm payrolls is an increase in the range of 650,000. 

(Source: Reuters)

The Household Survey revealed unemployment was little changed in April, holding at 6.1 percent (March: 6.0 percent). Note the report’s official unemployment rate calculates by dividing the number of unemployed Americans (actively seeking employment) by the civilian labour force count. 

According to the BLS, and also evident from the graph plotted below, April’s measures are significantly lower than April’s (2020) pandemic highs of 14.8 percent, but at the same time higher than pre-pandemic levels of 3.5 percent. 

The real unemployment rate (U-6)—a broader view of unemployment than the official (U-3) release—represents the total of unemployed in the United States, including all persons marginally attached to the labour force and total employed part time for economic reasons (The BLS notes that marginally attached are those who currently are neither working nor looking for work but indicate that they want and are available for a job and have looked for work sometime in the past 12 months. Discouraged workers, a subset of the marginally attached, have given a job-market related reason for not currently looking for work. Persons employed part time for economic reasons are those who want and are available for full-time work but have had to settle for a part-time schedule). As you can see, the official release is artificially depressed. 

April’s U-6 unemployment figure came in at 10.4 percent, down 0.3 percentage points from March‘s 10.7 percent reading—the lowest reading since March 2020.  It is also worth noting that April’s 2020 pandemic high came in at an eye-popping 22.9 percent, while the U-3 official release was, as noted above, 14.8 percent.

May’s official US headline unemployment reading is forecasted to tick lower at 5.9 percent.

(Source: Reuters)

Calculated by the Establishment Survey, average hourly earnings is another key metric watched by economists and investors, measuring the amount private employees earn each hour in the United States. 

In April, average hourly earnings suggested rising demand for labour, increasing by 0.7 percent from March’s -0.1 percent reading—this is the highest percentage print this year. (average hourly earnings for all employees on private nonfarm payrolls increased by 21 cents to $30.17, following a decline of 4 cents in the prior month—a touch higher than April’s 2020 reading of $30.07).  

The consensus for May’s average hourly earnings is forecasted to decline 0.2 percent.

(Source: Reuters)

FP Markets Technical View

To gather an overall picture of the US dollar’s position ahead of today’s US employment release, the FP Markets research team has analysed—from a technicalperspective—the US dollar index according to the long-term monthly timeframe, the daily timeframe, as well as the H1 timeframe.

(Figure 1.A: EUR/USD Vs. US Dollar Index)

Monthly timeframe:

From the monthly chart, technicians will note April spun lower from a trendline support-turned resistance, extended from the low 72.69, with May extending downside to within striking distance of support from 88.55 (note we also have a 50% retracement level nearby at 88.28 and a 61.8% Fib at 88.27). Overall, the major trend is lower (see arrows). Couple this with the recent trendline support breach, this emphasises a bearish USD market, long term. 

(Source: Trading View—US dollar index monthly chart)

Daily timeframe: 

A closer reading of price action on the daily scale shows they recently breached the upper side of what’s known as a declining wedge pattern (91.43/90.42). This—given the bearish narrative since March 31st peaks at 93.43—is likely considered a reversal signal, with buyers taking aim at 90.91 (the wedge pattern’s take-profit target, derived from taking the base measure and extending this value from the breakout point [red]). 

As for trend on this timeframe, we can, in line with monthly price action, see this market has been entrenched within a downtrend since topping in early March 2020, just south of the 103.00 figure. 

Also notable on the daily chart is we’re coming from support at 89.67 and, in recent days, elbowed north of resistance coming in at 90.10 (now labelled support). 

Ultimately, traders are likely expecting a bearish reaction off 90.91, as sellers look to fade into the current pullback.  

(Source: Trading View—US dollar index daily chart)

H1 timeframe: 

From a shorter-term perspective, chart studies reveal the DXY recently touched gloves with a harmonic Gartley pattern (potential reversal zone [red] made up of a 78.6% Fib at 90.61, a 100% Fib projection at 90.57 and a 1.272% Fib extension at 90.66). 

Should the above formation hold, support is considered an initial roadblock at 90.43, followed by the 38.2% Fib at 90.20 and the 61.8% Fib at 89.95 (values derived from legs A-D of the Gartley). 

(Source: Trading View—US dollar index hourly chart)

Stocks seem wobbly. Are markets heading for a correction?

Stock markets across the world look overvalued, and many market participants are calling for a correction. Many catalysts could cause a sharp sell-off - such as rising yields, inflation pressures, strengthening US dollar, and so on.

The greenback usually advances during risk-off sentiment. Considering the dollar index has broken to the upside from a large falling wedge pattern which is a bullish formation, further gains seem likely. 

As we saw last week, the entire market, including small and mid-cap markets, is sensitive to sharp increases in rates. Tech companies, which usually have no earnings, dropped the most as they are the most sensitive to higher rates. 

Should the USD and yields continue to go higher, it will most likely cause some serious troubles in the equity markets. 

Additionally, according to the Bank of America, investors' cash levels fell to 4.0%, triggering a “sell signal”; The last time the sell signal was triggered was in February 2020 - everyone knows what happened next.

Another indicator from the Bofa, the Sell Side Indicator (SSI), is about sending a sell signal. The last time the indicator was this close to “Sell” was June 2007, after which we generally saw 12-month returns of -13%. 

The long-term trend in US stocks is still bullish, and only a very significant correction would change that. However, the short-term picture doesn't look so positive, and we might see some declines over the next few days.

4 Years of Trump VS the Markets. Who Wins After 4 Rounds?

President Trump branded himself as something of a saviour for the financial markets during his tenure. 

He repeatedly stated, often vociferously, how the markets "love" him, and also publicly celebrated the strength of the world's largest economy, taking most of the credit for its positive performance in the process.  

His grandiose claims aren't unlike a boxer's public declarations before a fight, a commonly-used strategy to 'psych-out' opponents and promote the event they're taking part in. 

Trumps' continuous claims that the markets are stronger than ever, began when he first took office. He's credited the strength of the markets to his administration's pro-growth policies. 

In fact, he's tweeted about how great he is for the markets, at least 150 times since he's been in office, taking jabs at the Democrats' performance whenever he can. 

But has the market really come out on top after 4 years of Trump? Let’s take a closer look, separate fact from fiction and see which one of the two wins after the last 4 years of Trump as president.

Let's get ready to rumble! 

In one corner… 

U.S. President Trump, weighing in at 235 pounds (according to his doctor), and prone to punching below the belt. His strengths; insisting loudly that his presidency has been GREAT for the markets.

And in the other corner … 

The data, weighing in with a series of cold, hard-hitting facts (and also a few Trump knockouts under its belt). 

ROUND 1 

During his first year in office, the stock markets responded well to President Trump. It was a trend largely driven by an increase in tax cuts and the Fed's decision to lower interest rates. As a result, the market was not only stable but seeing consistent positive growth too. 

In the 3rd quarter, GDP (gross domestic product) reached 3.3%. The stock market saw great growth, even breaking the 90-year record of positive returns for all 12 months.  

The S&P 500 went up 19.42%, and its total return was 21.83%. This bullish market was the second-longest in modern history, beginning from March 9, 2009, and continuing 105 months through December 2017 without experiencing a decline of 20% (or more) from a closing high. 

A new tax bill approved in December of 2017 lowered the corporate tax rate from 35% to 21%. This contributed to some of that market growth. The lower tax rate improved profit margins. The oil market finished the year on high (yes, those were the days), rallying in the last months of 2017. 

Moreover, consumer spending and retail sales are also nurtured throughout the year. 

All the growth culminated in a first-round win for Trump. Many attributed this great market run as a legacy of Obama’s economic plans, but, not surprisingly Trump didn’t agree, and didn’t hesitate to take all the credit. 

ROUND 2

Trump's second year in the office started smoothly but was met with a sharp decline that resulted in zero net progress. 

2018 was a tenuous year for the markets in general, which hit record highs and severe reversals. This was the first time ever the S&P 500 saw a drop after rising in the first three quarters. 

In the last quarter, both S&P and Dow Jones plunged 13.97% and 11.8%, respectively. December was a frustrating month, as all indexes dropped 8.7%. Also, Dow and S&P 500 recorded the worst December performance since 1931. 

The main reason for this uncertainty was that investors were fearful of the Federal Reserve’s policies and concerns over the U.S-China trade deal. 

Besides this, there was a decline in the gold, oil, and bonds market. However, not all was wrong in 2018. First, three quarters saw a bullish trend, and the USD went up by 4.5%. 

So we’ll call this one as a win for Trump, even if it is tenuous. 

ROUND 3

Entering into the third year, we begin seeing a different story. Trump starts a trade war with China, and the stock market declines, mostly due to rising interest rates and the president's handling of the on-going Chinese trade negotiations and recreation of NAFTA (United States, Mexico, Canada Agreement). 

The trade war was a major headline for the markets throughout the year, but something happened, which nobody was expecting. After the inception of the bearish market, the year ended with the biggest gains from stocks since 2013. 

The S&P 500 went up 29%, and the Nasdaq went up 35%. With the Nasdaq upsurge, Microsoft and Apple enter into the trillion-dollar club. 

So, how did that happen? It was mainly due to a change in the Federal Reserve policy. With the falling interest rates, investors poured their money to get more yield. 

However, the growth rate was slower than in the previous two years. 

ROUND 4

2020 started with the bullish trend, and everything was going smooth, until…. you know what I am talking about; Covid-19, or as the president called it, the "China Virus." 

On March 18, 2020, the stock markets plunged to the same level it had been on the day of President Trump's inauguration. That means any progress under Trump's presidency was wiped out in a matter of two weeks. The real shocker was oil prices. The WTI plummeted 65% since January 2020. And it is not looking great ahead either. 

The market did recover from June as bulls started to overthrow bears. FAANG (Facebook, Amazon, Apple, Netflix, and Google) were apples of investors' eyes. Also, gold prices went way up, crossing the $2000 mark. 

This was a good sign for the Trump administration as this was a hard year, and it was also a good sign for traders and investors who were pulling their hair when the pandemic started. Republicans even announced a $2 Trillion coronavirus relief package to boost the economy. In addition, it provided jobs to more than half of those people who lost their jobs during the pandemic. 

But, the pandemic isn't over. With lockdowns already starting to take place in Europe, and the U.S. elections, the markets will remain uncertain, at least for a few weeks. One major concern is the declining USD. Many analysts predict that this uncertainty will decrease after the election results. We just have to wait and find out. 

The Winner Is…. 

With the 2020 elections result still coming in, Donald Trump did what he promised. After 4 years in the white house, Trump delivered for the markets, before experiencing a crushing defeat by ill-advised strategies and a global pandemic.  In the first year, the stock markets saw record-breaking highs. No one is to say what the data would have shown had COVID not occurred. All being said, the markets have been relatively stable under Trump, if you count out the uncertainty caused by the pandemic. However, the reality is the pandemic did happen and worsened what was already a troubled market.

What Now?

As election drama unfolds, we’re on the verge of finding out if a new game of boxing begins between Trump and the Markets.